Lab 3.6 - Release to production and read your DORA metrics
Level: 3 Release Manager
Time: ~35 min
You will: release to production, and then measure whether your pipeline is any good.
The situation
UAT signed off. The release goes to production this evening.
This is the same mechanism as Lab 3.5, twice: uat into preprod, then preprod into main. With one
difference that is not technical: if you get it wrong, real people cannot do their jobs tomorrow.
Everything in this lab that looks like ceremony is there because somebody skipped it once.
Before you start
- Lab 3.5 finished:
uatcarries the release and the testers signed it off -
helios-preprodandhelios-prodconnected, seeded, and configured as thepreprodandmainorgs in Lab 3.1 - JWT authentication working for
preprodandmain
Steps
1. Check the three things that are worth checking
Before creating anything:
One: is UAT genuinely signed off? Not "the deployment was green". Somebody tested it and said yes. On this project that person is you, and you did it in Lab 3.5 step 6.
Two: what manual steps will this carry? Look at the deployment actions of the stories going out. A manual step in production is something you will do, live, in front of nobody, at whatever time the release is. Know about it now.
Three: is production where you think it is? Open helios-prod and look. It should carry what
the course seeded into it and nothing else yet. On a real project, admins change production by hand
between two releases, and Lab 3.7 is about exactly that. Assume nothing.
2. Rehearse in preprod
The same way you created the promotion in Lab 3.5: the + PR chip on the arrow from uat to
preprod, in the DevOps Pipeline diagram. GitHub opens on the Pull Request from uat into
preprod.
Its check job is the first one to log into helios-preprod, and it does so with the key and the
secrets of Lab 3.1. This is the first JWT login of the course, so look at it once: open the check
from Checks, expand Login & Simulate deployment, and look for sf org login jwt. That line,
and the job carrying on past it, are your preprod key working, even on the first run, which stops
red further down for another reason.
Title it plainly:
Promotion 2026-09 to preprod
Its first check stops red, on purpose, the way the promotion to uat did in
Lab 3.5 step 4: the deliverability step of US-026 runs before the deployment, and nobody has done
it in helios-preprod. Do the click there, tick its box in the sfdx-hardis comment (or Mark as
done in preprod in the VS Code Deployment Actions tab), then Re-run all jobs on the check.
It goes green.
Read the check, merge, and watch the Process Deployment (sfdx-hardis) run on preprod. Then
open helios-preprod and do the checks of step 6 there first.
This is what preprod is for. It holds what production holds, nobody works in it, and a release
that deploys there cleanly and behaves has very little left to surprise you with in production. A
release that fails here has cost you nothing.
3. Create the production Pull Request
The + PR chip on the arrow from preprod to main, from preprod into main. Its check job is
the first JWT login into helios-prod, with sf org login jwt in its log as in step 2. Title it
plainly:
Release 2026-09 to production
Its first check stops red for the same reason as in step 2, in the last org where nobody has done
the deliverability step: helios-prod. Do the click in production, tick the box, Re-run all
jobs, and read the green check that follows.
4. Read the check like it matters
When the check finishes, read the sfdx-hardis comment the way Lab 3.2 taught, and add two questions that only apply to production:
| Question | Where to look |
|---|---|
| Does it delete anything? | The deleted figure in the Metadata row, shown only when something goes. A deletion in production is permanent and takes data with it |
| How long will it take? | The check duration is a reasonable estimate. If it is 40 minutes, that is 40 minutes during which the org is being modified |
If that figure is there and you were not expecting it, stop. The comment will not tell you
what is going: manifest/destructiveChanges.xml and the diff will. Find out what it is and who
intended it. That is not being careful, that is the job.
5. Merge, and stay
Merge. The Process Deployment (sfdx-hardis) run starts, this time on main.
Watch it. Not because you can do anything while it runs, but because knowing whether it failed at minute two or minute thirty-five changes what you do next.
When it finishes, do the post-deployment manual steps, if any, then check the org. The pre-deployment ones belong before the merge: do them, tick their boxes in the check comment, then merge, and the deployment job records them, as in Lab 3.5.
6. Verify in production
Open helios-prod from Orgs Manager: find it by its alias (2), check it says Connected
(3), then Open from the actions menu at the end of its row. A disconnected row offers
Reconnect in that same menu; Add Org (1) is for an org the table does not have.
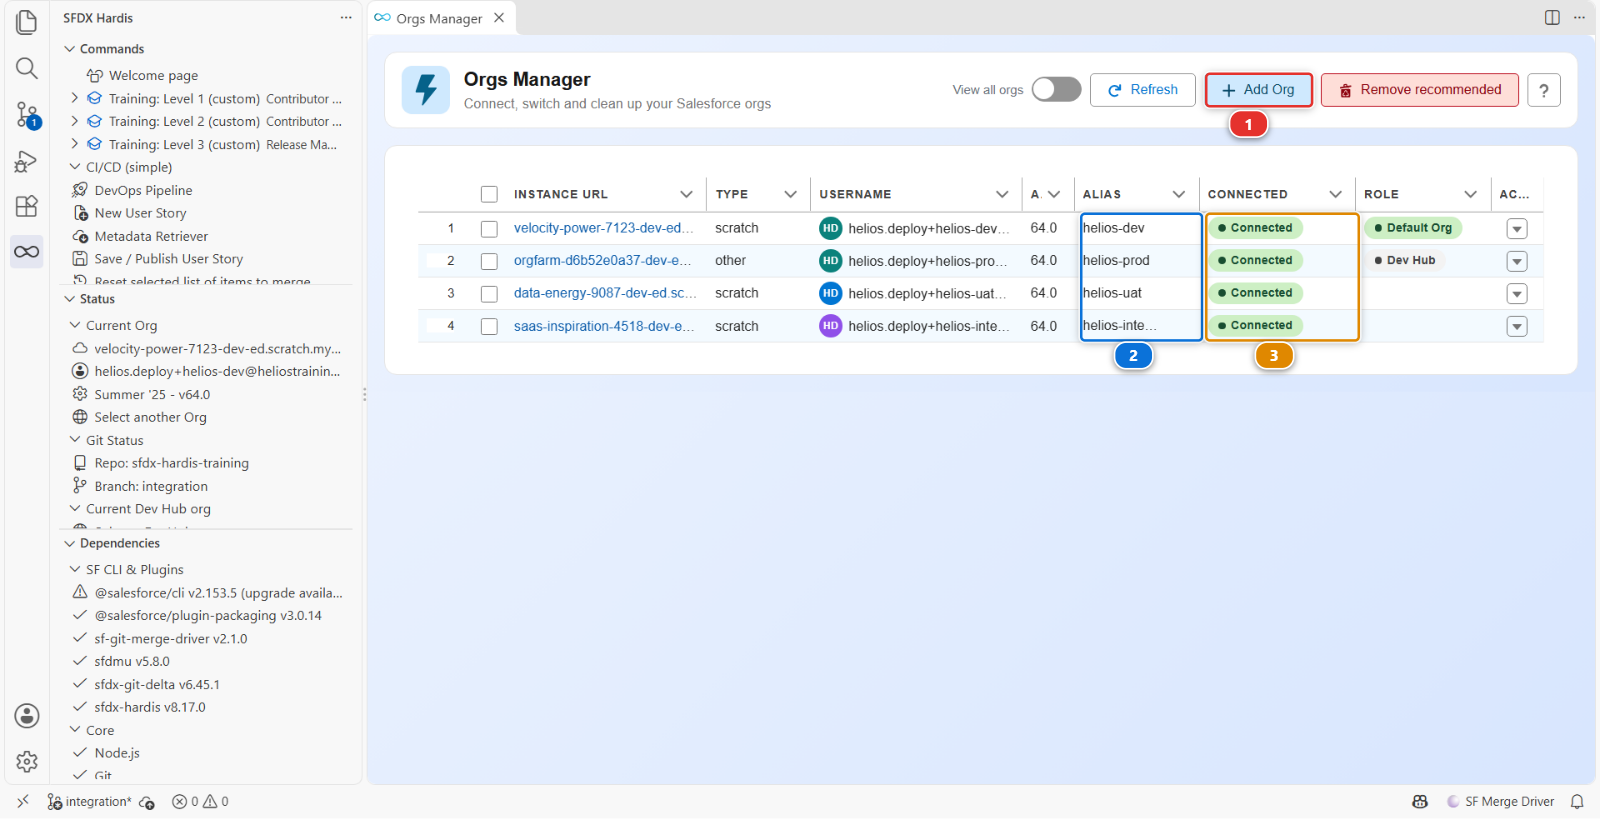
Then check, the same as UAT and with more care:
- The two stories work
- Something that was already working still works: open an installation, check the timeline component, save a record
That last check exists because the most common production incident after a release is not the new feature failing. It is an old one.
7. Now measure the pipeline
You have shipped. The question a release manager gets asked next is "how are we doing", and it deserves a better answer than a feeling.
Open the DevOps Pipeline panel, click the gear (1) at the top right, and choose DORA metrics (2). The menu holds three entries and you used the other two in Lab 3.1: Pipeline Settings and Add/Configure Org.
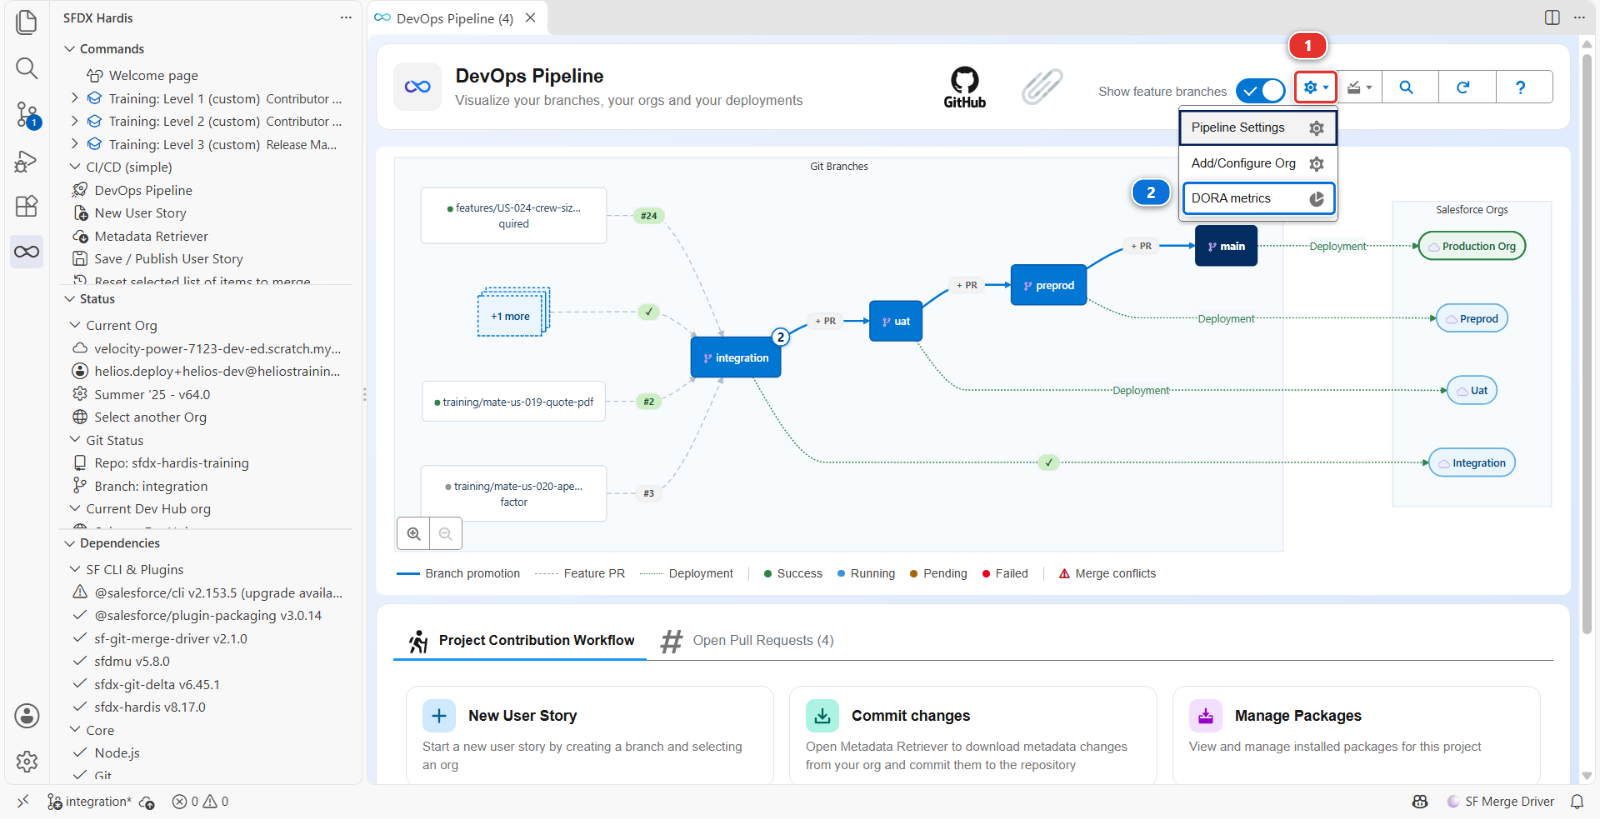
A DORA metrics tab opens and says, for a few seconds, that it is reading deployment jobs and Pull Requests from GitHub. That sentence is the whole design. Nothing is asked of any org, so there is no default org to set first, and two people on the same project read the same numbers. What the panel needs is the connection to GitHub you gave the extension in Lab 1.2.
It lands on its Overview tab:
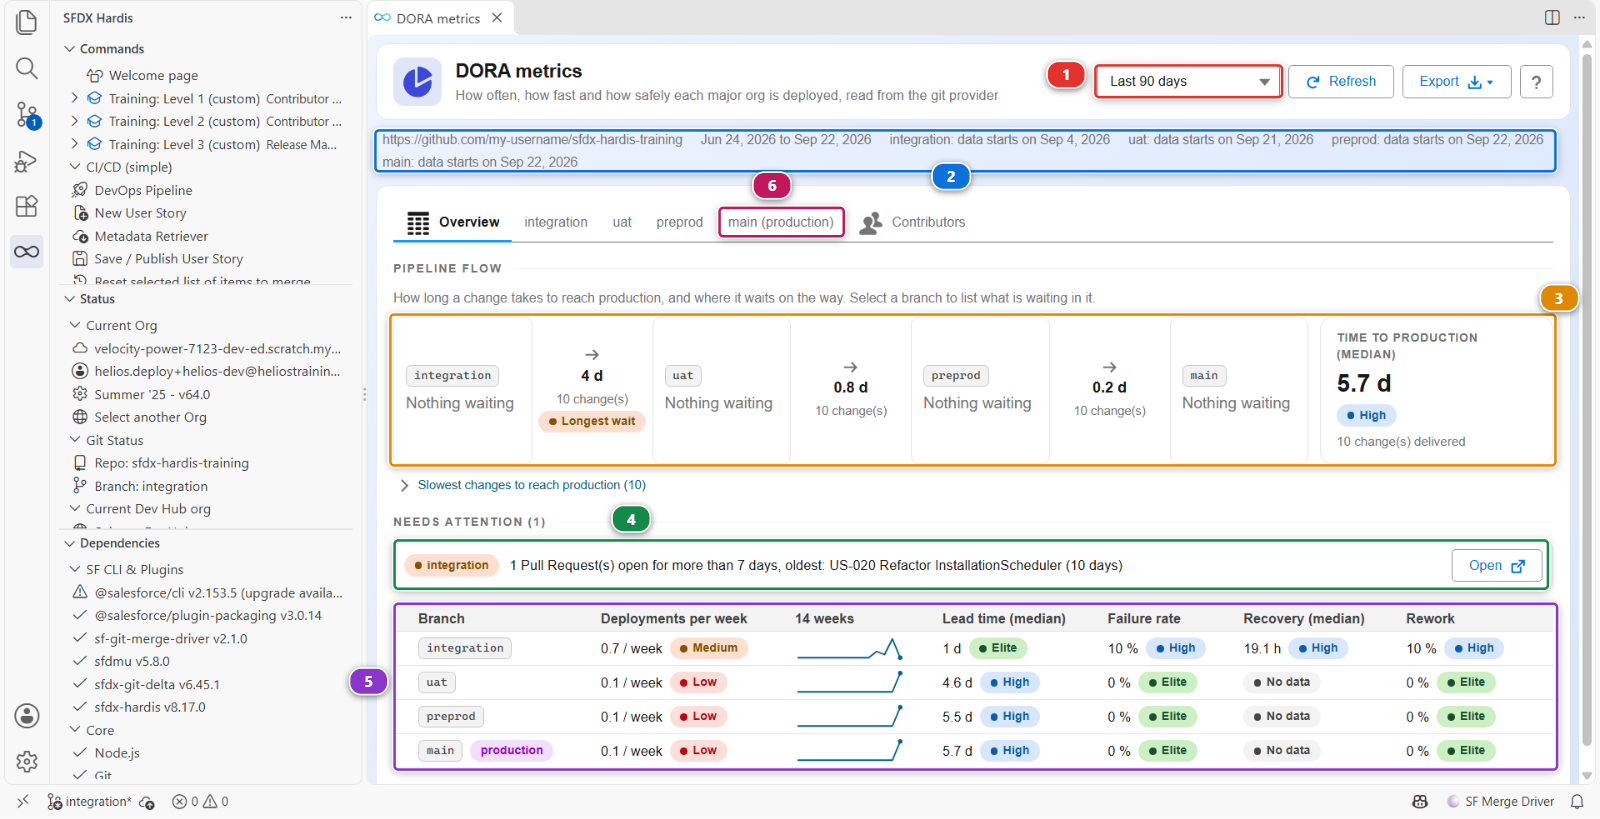
Read the frame before the numbers:
- The period (1) is Last 90 days unless you pick 30, 180 or 365
- The line under the title (2) names the repository and the dates of the period, then says where the data of a branch starts when that is more than a week after the period does. Here it says so for all four branches: your pipeline is younger than the period it is measured over
- Pipeline flow (3) follows your User Stories from one org to the next. You read it in a moment, below
- Needs attention (4) is there only when sfdx-hardis has something to point at, each line with the branch it is about and, when there is something to open, an Open button. It knows five cases: the last deployment job of a branch failed, Pull Requests have been open for more than 7 days, the failure rate is above 10 % and rose by 5 points since the period before, nothing was deployed for 30 days, User Stories have been waiting in an org for more than 30 days. If you sent US-020 back more than a week ago, it is on that list, and rightly so: a Pull Request nobody merges and nobody closes is a decision somebody is not making
- The table (5) holds one row per major org, in the order of the pipeline, with
mainmarked production. A row opens the tab of its branch, the one ofmainbeing (6)
Pipeline flow answers the question the table cannot: how long does a User Story take to reach production, and where does it wait. The figures quoted below are the ones of the picture, a learner who spread the course over a week: yours follow the days your own course took and the number of User Stories you delivered, and a course done in one sitting reads hours, not days. Read it from left to right:
- Each box is an org of the pipeline. It says how many User Stories are in that org and went no further, and how long the oldest has been there. Yours all read Nothing waiting: you have just released everything. On a real project this is where a release manager looks first, and a click on a box lists the User Stories waiting in it
- Between two boxes, the arrow carries the median wait: the days between the deployment of a User
Story in one org and its deployment in the next. Yours waited 4 d in
integration, 0.8 d inuatand 0.2 d inpreprod. The longest of them is marked Longest wait - Time to production (median), on the right, is the whole trip: from the creation of the Pull Request of a User Story to the end of the job that deployed it to production. 5.7 d, High, over the ten User Stories you delivered
- Slowest changes to reach production opens the list behind that number, each User Story with the day it reached each org. The slowest is the first one you ever merged: it waited for the pipeline to exist
A User Story is followed from the Pull Requests alone. Merging integration into uat carries
every User Story that was in integration at that moment, and the days are counted from there.
Each row carries five numbers. Each one is rated Elite, High, Medium or Low, on the same scale for every branch, or reads No data:
| Column | What it actually counts | What good looks like |
|---|---|---|
| Deployments per week | Successful runs of the deployment job of the branch, divided by the length of the period | Weekly is fine. Quarterly means every release is enormous |
| Lead time (median) | Per User Story that reached the org: the creation of its Pull Request, to its deployment there | Days, not weeks. A long lead time means work is sitting somewhere |
| Failure rate | Failed deployment jobs, divided by failed plus succeeded. A cancelled job is in neither | Below 15 %. Above that, the check is not catching what it should |
| Recovery (median) | Hours from a failed deployment job to the next one that succeeds on the same branch | Hours |
| Rework | Pull Requests from a fix branch, or successes within a day of a failure, whichever is the larger | Low. Read the note below before you expect Lab 3.7 to move it |
The column between the first two, named after the number of weeks in the period, draws the deployments of the branch week by week.
Two of those are not what the names suggest, and it is worth knowing which. Failure rate is the failure rate of a job: a release that deployed green and broke production on Tuesday does not appear in it. Recovery is the gap between a red deployment job and the next green one, not between an incident and its fix. They measure your pipeline, not your org. And the pipeline is all they see: a deployment made around it, a change set or the seeding Set up one of my training orgs did, is counted nowhere.
8. Read what is there, and know what is missing
Click the main row, or the main (production) tab (1).
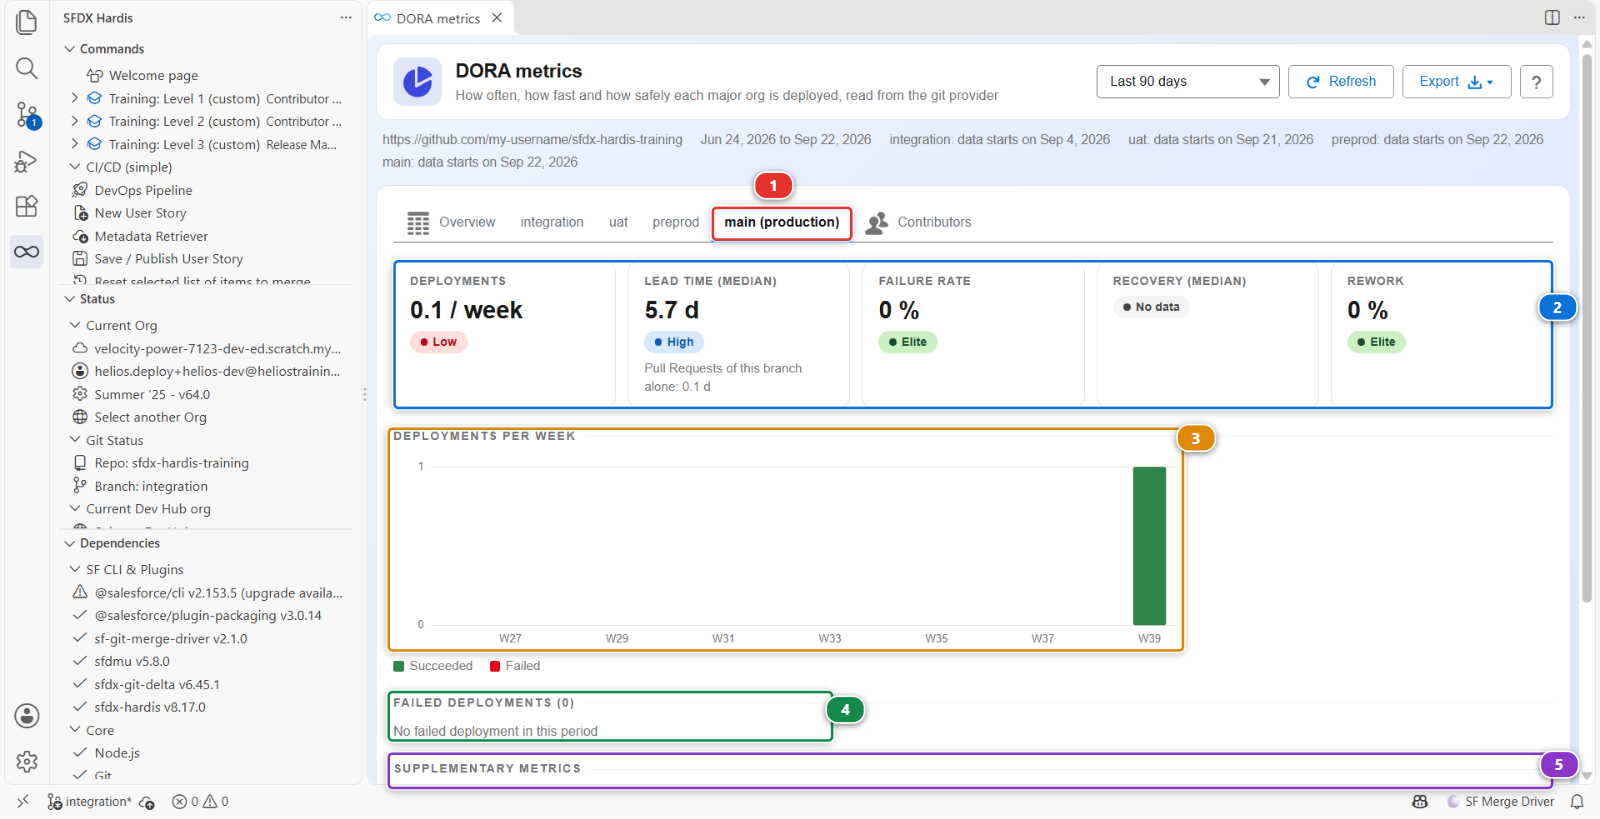
The tab holds the five numbers as tiles (2), the deployments of each week as bars, green for succeeded and red for failed (3), the failed deployments with the time each took to recover (4), and the supplementary metrics (5). Scroll down for the rest of those, and for two lists that open on a click: the Pull Requests that took more than 7 days to merge, and the hotfix Pull Requests.
You have shipped once, and this tab says exactly that. Read it number by number, because each one is true and none of them means what a hurried reader would take from it:
- Deployments: 0.1 / week, Low. One successful job, divided by a period of 90 days that was empty until this week. The rating is about the period, not about you. Pick Last 30 days and the same single deployment weighs three times as much
- Lead time (median): 5.7 d, High. The time your User Stories took to reach production, each one from the creation of its own Pull Request: the number Time to production showed on the Overview. Under it, Pull Requests of this branch alone: 0.1 d is the life of the release Pull Request, from the + PR chip to the end of its deployment job. A couple of hours, and it would rate Elite. Quoting that one as your lead time would be flattering and wrong: the release was quick, the User Stories it carried had been waiting for days
- Failure rate: 0 %, Elite, and Rework: 0 %, Elite, over one deployment. One red job next week and the first reads 50 %
- Recovery (median): No data. Nothing failed on
main, so there is nothing to recover from. No data is the honest answer, not an error
The picture is one learner's evening, and yours will differ in the detail: the dates, a second job
on main if you merged twice. The shape will not.
Now open the integration tab. That is where your history is: one deployment for every Pull
Request merged since you started, and the red job of Lab 3.3 in Failed deployments, with the
time until the next green job. Over ten deployments, that single failure is ten points of failure
rate. Small numbers move in big steps.
That is the honest version of this step, and it is also the point. DORA metrics on a pipeline that has released once are an empty baseline. They become useful at the fourth or fifth release, when the numbers have somewhere to move from: the panel then draws an arrow next to each one and prints its value over the previous period. Today the period before is empty, so there is no arrow.
9. Keep the baseline
The numbers on screen are read again each time, so the baseline has to be a file. Open Export (1) and choose Markdown report (2):
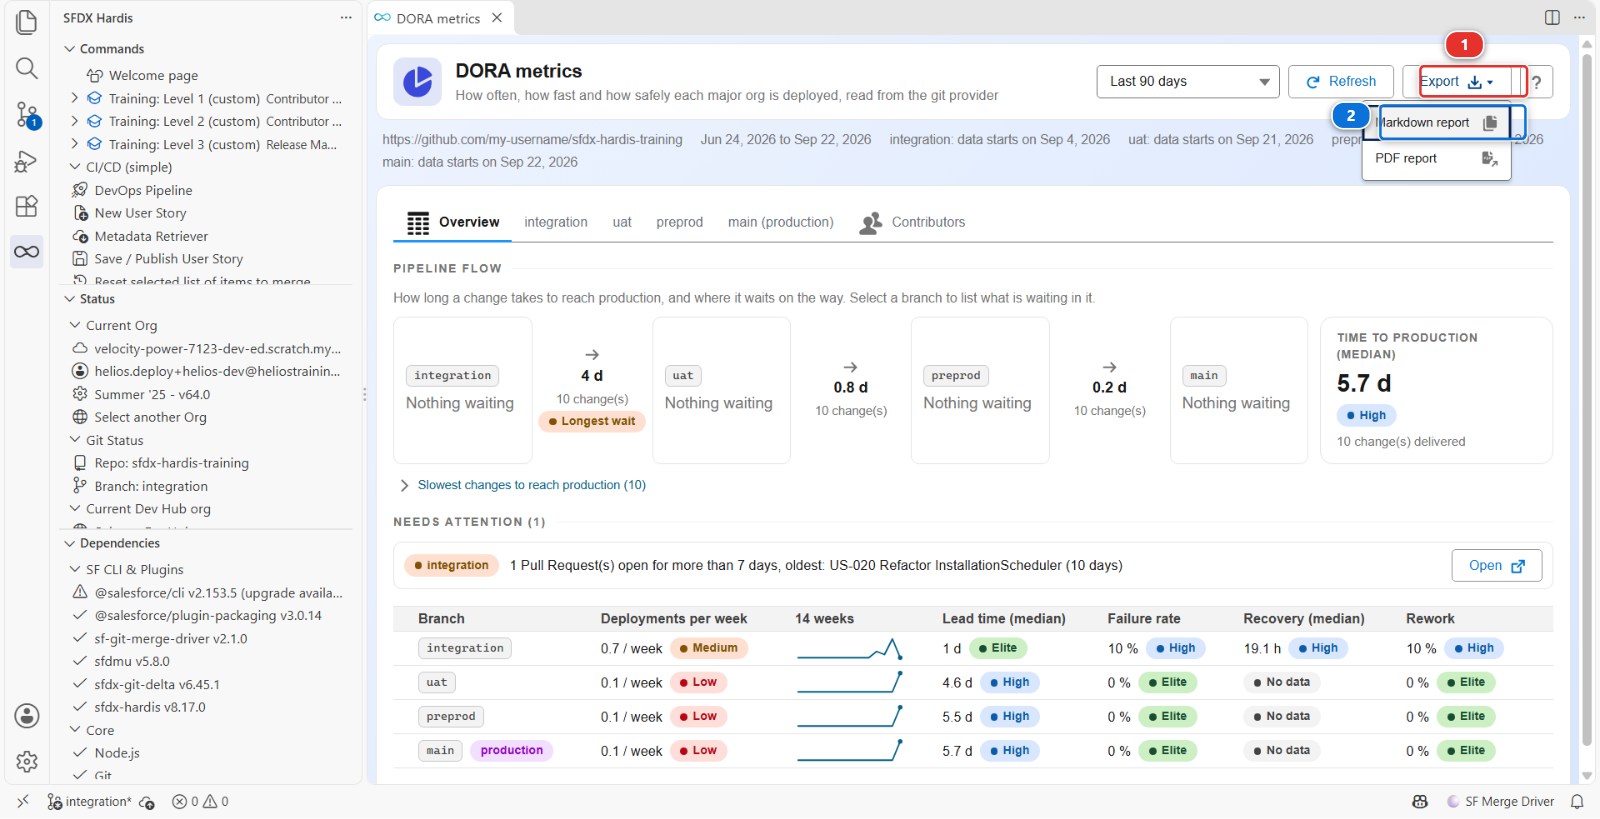
The command panel opens and writes the report for the same period: a summary of every branch, then a chapter per branch. When it has finished, its DORA Metrics Report button opens the file. The other entry, PDF report, writes a PDF as well.
The report is a file, docs/dora/dora-report-<date>.md, and Check my work looks for it. Keep it
where it is: it is rebuilt from the jobs and the Pull Requests whenever you export again, so nothing
is committed, and Lab 3.11 compares the next one with this one. The file is named after the day,
so a second export on the same day replaces it: if you go on to Lab 3.11 today, note the numbers of
integration and main first, or copy the file under another name.
Under the hood: where the DORA numbers come from
The panel ran:
sf hardis:doc:dora-report --agent --data-only --compare --period 90 --json
and Export ran the same command without those flags, in the command panel:
sf hardis:doc:dora-report --period 90
It has one source, the git provider, which is the thing to know about it. Until sfdx-hardis 8.16 the deployments were read from the org; they no longer are, and the command does not log into any org:
- A deployment is a run of the deployment job of a major branch, the one a merge starts. On GitHub that is a run of the Process Deployment (sfdx-hardis) workflow triggered by a push to the branch. Runs that no merge started, a scheduled one for instance, are not deployments
- A validation is the deployment check of a Pull Request, here a run of Simulate Deployment (sfdx-hardis). The Validation success rate of the supplementary metrics is built on them
- The Pull Requests merged into each major branch, and the ones still open
The jobs are told apart by their name. In a project that renamed them, when no run of a branch is named as a deployment, every run a push to that branch started counts as one.
It measures every major branch, which means every config/branches/.sfdx-hardis.<branch>.yml of
the project, when a person runs it. In a CI job it measures the branch of the job, and --branches
names them explicitly. Then, per branch:
- A merge is deployed by the successful job of its merge commit, or, when the provider does not say which one that is, by the first successful job started within 14 days of the merge. With neither, the merge date stands for the deployment
- Lead time is counted per User Story: from the creation of its Pull Request to its deployment in the org of the tab, whatever merge brought it there. The line under it keeps the older reading, the Pull Requests merged into that branch alone, which is also what a notification to Grafana carries
- Rework takes the larger of two counts, the Pull Requests whose branch starts with
hotfix,fixorbugfix, and the successful jobs that follow a failed one within 24 hours, and divides it by the deployments - A cancelled job is counted apart and enters no rate
- A job run again on the same commit replaces its previous result on some providers. On GitHub, Re-run all jobs keeps the run and its last result, so the checks that stopped red on purpose in steps 2 and 3 count as green
How a User Story is followed. No git history is read, only the Pull Requests:
- A Pull Request from a major branch into the next one (
uatintopreprod) carries every User Story that was in its source branch when it was merged - A promotion Pull Request, the selective kind of Lab 3.10, carries the Pull Requests listed in its description and nothing else
- A hotfix merged straight into
preprodis counted frompreprod. The merge that brings it back down tointegrationdoes not send it through the pipeline a second time - A change cherry-picked by hand is not followed, and neither is one merged more than 90 days before the period
The steps between the orgs are the mergeTargets of each config/branches/.sfdx-hardis.<branch>.yml.
One thing to check on any project. Rework recognises a corrective change by its branch name.
This project names its fix branches fix/, so the hotfix you ship in Lab 3.7 counts, in the
Rework of preprod, the branch it is merged into. Rename that prefix to something else and the
metric quietly reads zero, with no warning. A number built on branch names is only as good as the
naming convention, which is worth checking before quoting one at anybody.
What the three flags of the panel do:
--data-onlyreturns the numbers and writes nothing: no report, no CSV, no notification. The panel draws that answer as it comes and computes nothing itself, so the panel and the report cannot disagree--comparealso computes the period of the same length just before, which is where the arrows and the previous values come from, and what lets a branch say when its data starts--periodis the list at the top of the panel
Finished jobs do not change, so sfdx-hardis keeps them in ~/.sfdx/sfdx-hardis-cache/dora, one file
per repository, and asks the provider only for the jobs of the last two days and the new ones.
Refresh adds --refresh, which reads everything again. The panel also keeps its last answer,
to have something to show while the next one is being read.
Export writes the report in hardis-report/, copies it to docs/dora/, and adds a CSV of the
jobs behind the numbers. A run on one branch also sends a notification, to Slack, Teams or Grafana
when one is configured; a run on your four branches sends none.
Without a git provider the command fails: there is no fallback on git log any more, and no number
is better than a wrong one. It also fails, saying which right is missing, when the token cannot
read the CI jobs. On GitHub that right is Actions: Read.
The numbers are honest in a way a dashboard somebody fills in by hand never is. Nobody can improve deployment frequency by editing a spreadsheet. They are also narrower than the DORA names suggest, and a release manager quoting them should know which part they cover.
Command documentation: hardis:doc:dora-report
What you should see
preprodandmaincarrying the release- A green Process Deployment (sfdx-hardis) run on
preprod, then one onmain - The stories working in
helios-prod - The DORA metrics panel with a row for each of your four branches, and one deployment on
main - A DORA report in
docs/dora/
If it goes wrong
The deployment to production fails on a component that worked in preprod. Production has drifted, or has something preprod does not: an extra validation rule, a record type, real data that violates a new constraint. Read the error. This is the single most common production deployment failure, and it is the argument for keeping preprod as close to production as you can.
The deployment half-succeeded. Salesforce deployments are atomic per deployment, so this usually means a post-deploy action failed after a successful deployment. The metadata is in, the action is not. Re-run the action, do not re-run the deployment.
The DORA metrics panel says "Upgrade sfdx-hardis". The panel needs sfdx-hardis 8.17.0 or later. Click Open Setup, upgrade sfdx-hardis there, then Try Again.
The panel says "Connect to your git provider". The extension has no connection to GitHub in this VS Code. Click Connect to Git and sign in, as in Lab 1.2. The panel reads the numbers as soon as it is connected.
The panel says "DORA metrics could not be read". The message under that title is the one of sfdx-hardis, and it names the cause. The one to know on a real project says the git provider token cannot read the CI jobs: on GitHub, the token lacks Actions: Read on the repository. Fix the token, then click Try Again.
A number reads "No data". Nothing to measure, which is not an error: Recovery on a branch where no deployment failed, or every number of a branch that was not deployed in the period.
The release you just merged is not in the numbers. Only finished jobs are counted. Wait for the Process Deployment (sfdx-hardis) run to end, then click Refresh.
Check my work says no DORA report was exported. Reading the panel writes no file. Do step 9: Export, then Markdown report.
Check your work
Welcome page > Training: Level 3 > Check my work, then pick Lab 3.6.
Go deeper
Next: Lab 3.7 - Production is broken: hotfix and retrofit